Calibration / Validation of the YAP
|
The Youth Activity Profile is a calibrated report tool that provides estimates of physical activity (PA) and sedentary behavior (SB) based on validated prediction algorithms. The work has involved a 10 year progression of research but the primary calibration and validation work is described in a published paper by Welk et al. 2021.
The software incorporates the published algorithms to enable users to obtain accurate group estimates of physical activity for school-based applications or for research. However, it is important to note that the precision of the algorithms may vary depending on the nature of school setting (e.g. urban / rural) or the location since there may be differences in how youth respond to items in different places. Contrary to popular belief, there is no single study that can 'validate' an instrument. A published paper can provide evidence of validity but ongoing research is needed to test the algorithms in different settings and populations.
A number of other colleagues and collaborators have used the YAP in various school-based applications (see papers by researchers affiliated with the SWITCH project and the Wellscapes project). Planned work is aimed at develop spatial measurement error models that would capture the variability in different regions and cultures more directly. It is also important to point out that studies have also tested the reliability, feasibility and validity of the YAP in international applications (see Fairclough et al and . Work is in progress to build an international collaboration to directly evaluate the utility in different countries for cross-cultural applications. |
References
|
Segmented Approach to Estimating PA Levels in Youth
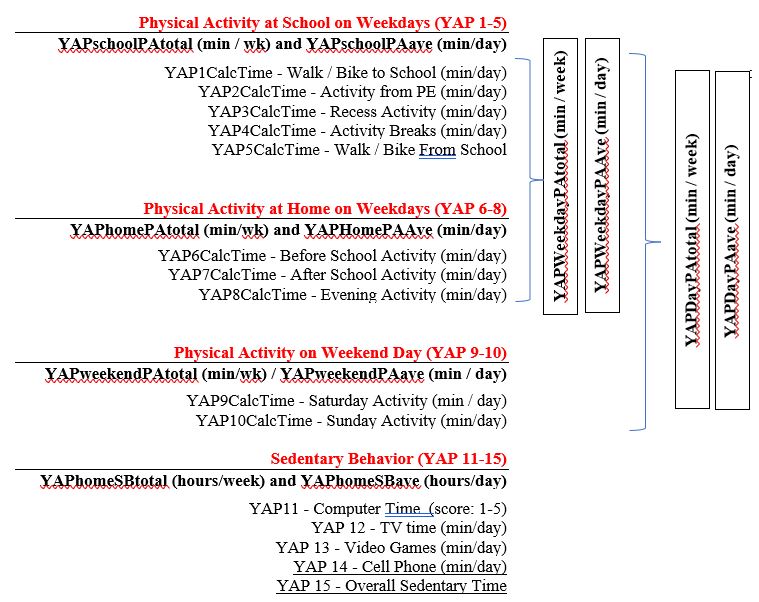
A unique aspect of the YAP is that the PA items (#1 to #10) are individually calibrated. This provides estimates of the time spent in PA for different segments of the day. Separate calculations are provided for the 5 items capturing PA in school’ (items 1-5), the 3 items capturing PA at home (items 6-8) and the 2 items capturing PA on weekends (items 9-10). The algorithms predict the % time spent in PA so the calculated time is based on standard time segments for each item. The calculated PA estimates are added together and averaged to provided estimates of PA on weekdays (combination of School PA and Home PA), PA on weekends (combination of Saturday / Sunday) and a weighted average based on 5 weekdays and 2 weekends. A separate composite calibration is used for estimating sedentary behavior.

Foundational Research on the YAP
The foundational calibration research for the original YAP calibrartion was carried out by Dr. Pedro Saint-Maurice as part of dissertation research in collaboration with Dr. Greg Welk in the Department of Kinesiology. The work demonstrated that raw scores from the YAP can be re-scored to estimate minutes of MVPA. This section presents some images from the original calibration work with the YAP. The figures are from different papers and projects to show how self-reported activity was consistently associated with measured activity levels obtained from accelerometers. Details from these original studies are provided below for context but the software currently uses the versions of the algorithms in the most recent paper on the online tool.
The foundational calibration research for the original YAP calibrartion was carried out by Dr. Pedro Saint-Maurice as part of dissertation research in collaboration with Dr. Greg Welk in the Department of Kinesiology. The work demonstrated that raw scores from the YAP can be re-scored to estimate minutes of MVPA. This section presents some images from the original calibration work with the YAP. The figures are from different papers and projects to show how self-reported activity was consistently associated with measured activity levels obtained from accelerometers. Details from these original studies are provided below for context but the software currently uses the versions of the algorithms in the most recent paper on the online tool.
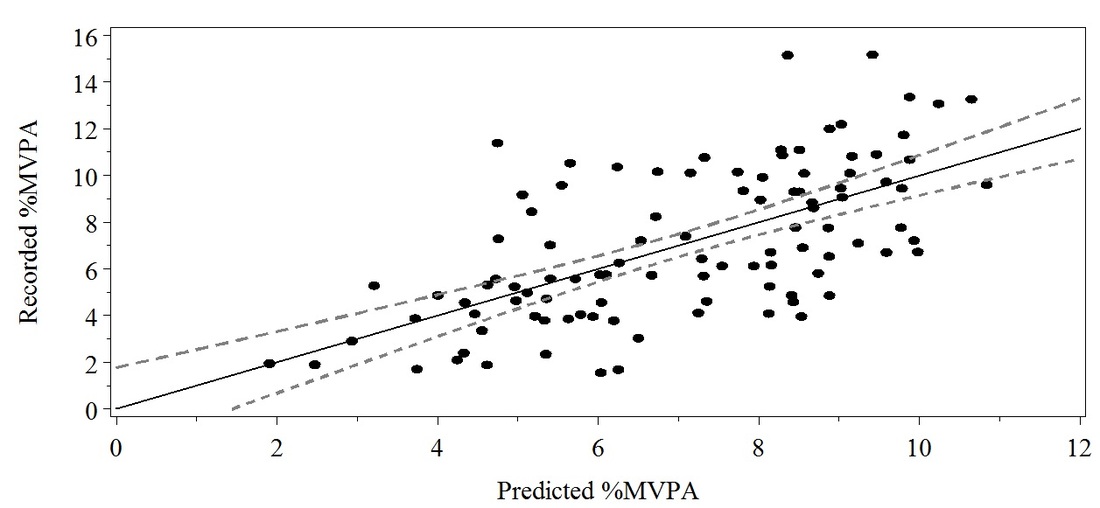
Figure 1 (below) illustrates the relationship between accelerometer activity levels (recorded %MVPA) and predicted activity levels (predicted %MVPA) in a sample of 103 participants (grades 4 through 12) from 9 schools (during the 2009–2010 school year). The solid line represents the best fit with the respective 95% confidence interval for the mean predicted values (dashed lines). The final model explained 40% of the variability in Recorded % MVPA. See Saint-Maurice et al, 2014.
FIGURE 1
Figure 2 (below)illustrates the relation between predicted and recorded minutes of MVPA in a sample of 45 youth (4th through 12th grades). The solid line represents the best fit line and the dashed lines represent the 95% confidence bounds about the best fit line. On average, the PAQ calibration equation produced similar accelerometer estimates of total minutes of MVPA (Mean diff. = 25.3 ± 18.1 minutes (t (44) = 1.40, p = .17).
See Saint-Maurice et al, 2017.
See Saint-Maurice et al, 2017.
FIGURE 2
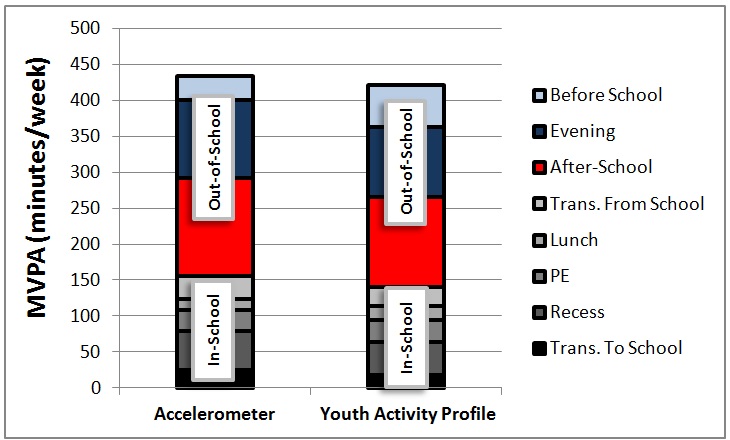
Figure 3 (below) illustrates the average estimates obtained from 161 youth (4th through 12th grades) of recorded (SWA) and predicted MVPA (YAP) for weekly activity at school and at out-of-school (segmented by window of activity). The plot shows that YAP individual items approximated measured activtiy for the respective time segments. Follow-up analyses demonstrated that YAP school and out-of-school activity were within 15% and 20% of SWA measured activity values for the respective segments. See Saint-Maurice & Welk, 2015.
FIGURE 3
FIGURE 4
Figure 4 (Below) illustrates group-level agreement for school (n=51), out-of-school (n=51), and weekend (n=39) activity using a 10% and 20% equivalence zones. The solid black line bar represents the confidence interval for predicted YAP MVPA values while the dashed and the rectangular lines represent the 10% and 20% equivalence zones based on GT3X+ MVPA values obtained from the wrist location, respectively. The algorithms tested were developed as part of the FLASHE study using a sample of ~119 adolescents (12-18yrs).
See Saint-Maurice et al, 2017.
See Saint-Maurice et al, 2017.
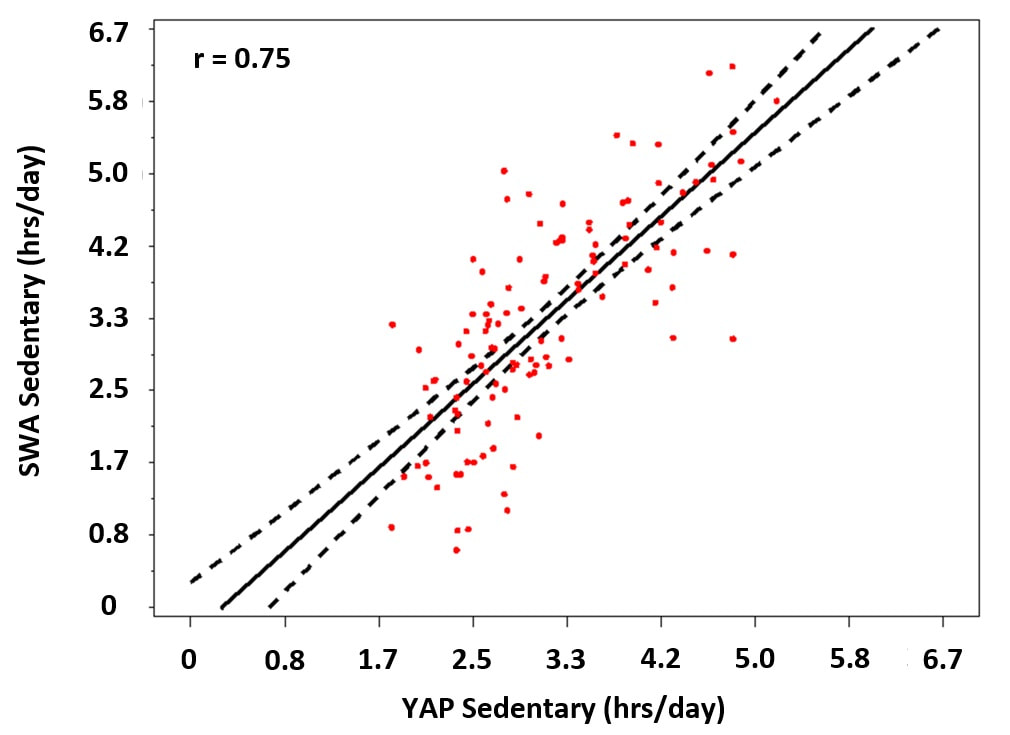
Figure 5 (below) illustrates the relation between measured and predicted minutes of time spent in sedentary. The line of best fit (solid black line) and respective 95% confidence interval (dashed black line) are provided. The predicted values illustrated above were validated on 161 children and adolescents (4th-12th grades). The algorithms tested were developed using a sample of 291 4th-12th grades.
See Saint-Maurice & Welk, 2015.
See Saint-Maurice & Welk, 2015.

